Project for the Web & Roadmap

Hello!

In this blog post, I would like to review Microsoft’s new “Project for the Web” & Roadmap products.

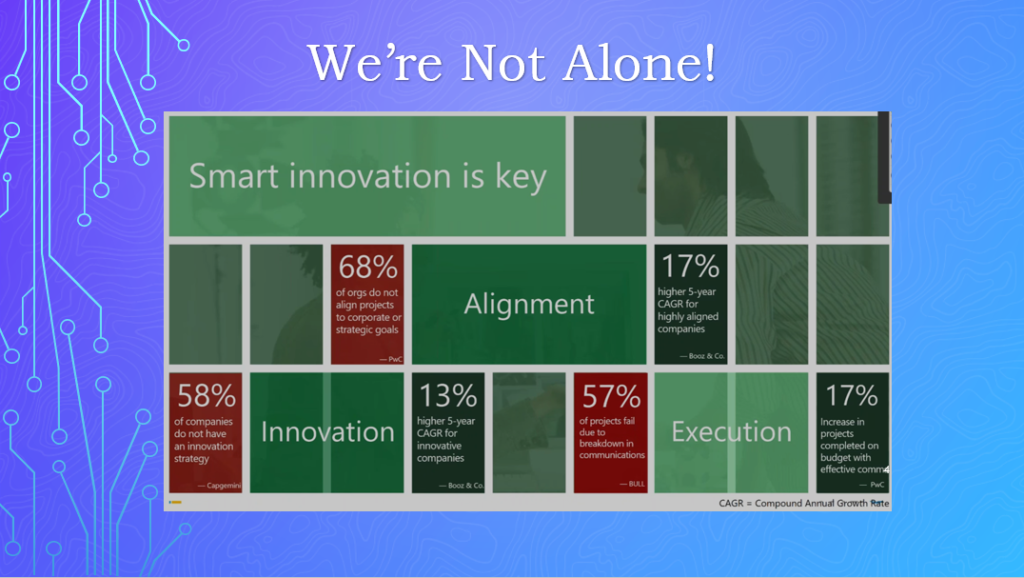
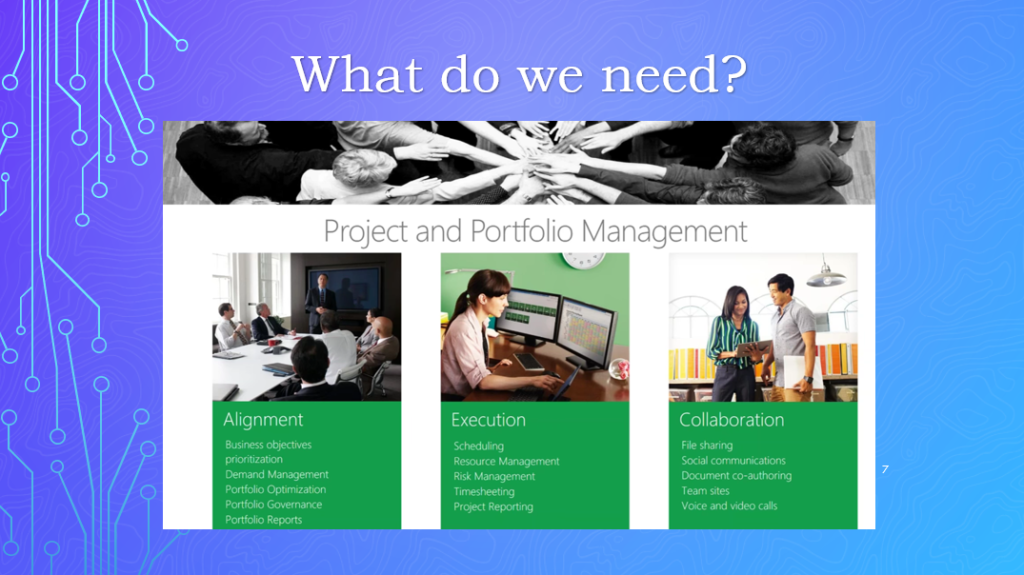
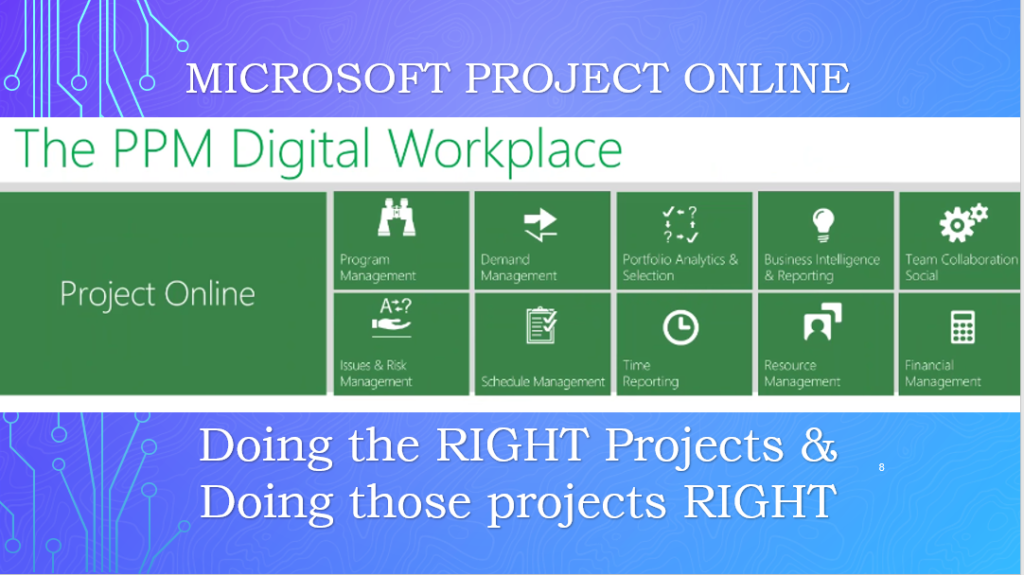
If you already have Office 365 and you do not have any good way of managing and tracking your projects and portfolio, I recommend checking Project for the Web and Roadmap. In one of my previous posts, I reviewed Microsoft’s Project Online, if you haven’t seen that, please check it out here: Streamlined Portfolio & Project Management/

So, which one should you be using? Here’s a quick comparison of these 2 products, before we dive into the details of Project for the Web and Roadmap.

High Level Comparison of Project For The Web vs Project Online

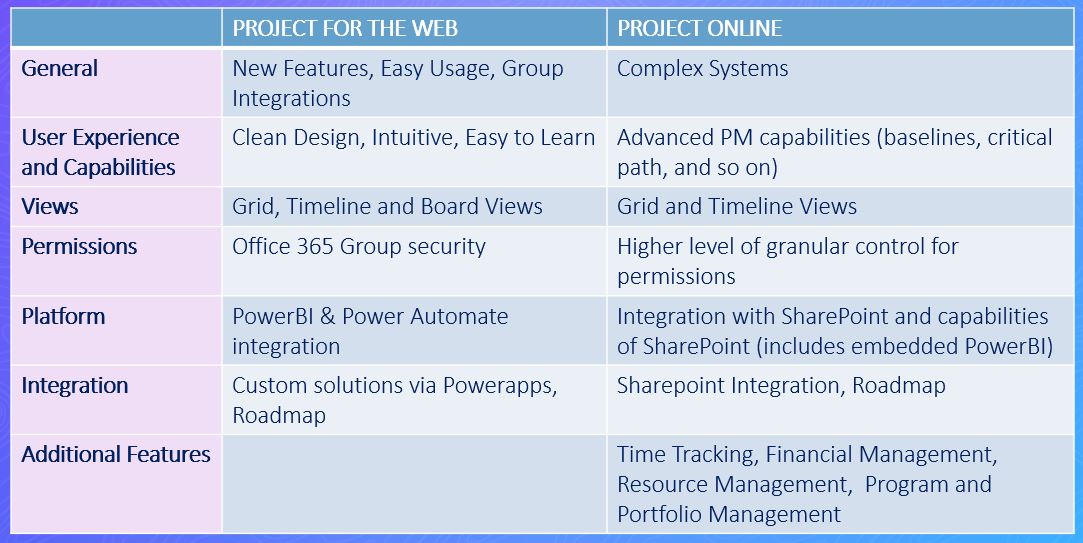
So, now that hopefully we have a better idea which product fits better for our needs, let’s look into how a new Project in Project For the Web looks like.

When you go to https://project.microsoft.com, you will see all your projects for the web and your roadmaps. The favorite Projects and Roadmaps are going to be at the top for easy access.

You can add a new Project or Roadmap by simply clicking “+ New blank project” or “New roadmap”

As you can see below, it’s a very clean and intuitive view. Below, the first image shows the project is in “Grid” view. As you can see, more columns can be added to this view.

Board view. The name of the buckets can be updated or new buckets can be added.

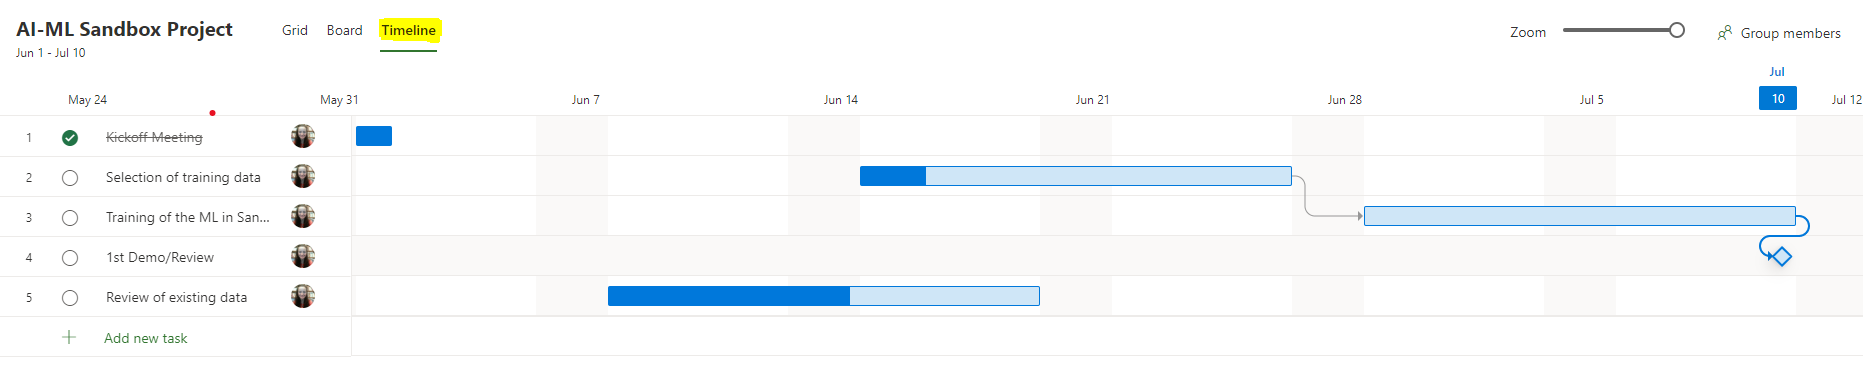
Here’s Timeline view, which also shows the dependencies:

Here’s how a roadmap can look like:

#1. You can easily add new rows to your roadmap. You can select either a Project for Web project or connect to your Azure Board and select items

#2. You can Add Key Date; which would then display on the roadmap as in #10. Project milestones would also show on the roadmap as a key date, as in #11

#3. Row items can be added to detail the project.

#4. You can move up and down the projects based on their priority or other criteria.

#5. Roadmap rows can be easily removed.

#6. We can zoom in and out to see a specific time period.

#7. Filter can be used to display roadmap items based on the ownership

#8. Like Zoom, we can go to a specific date to see what’s going on around that time.

#9. The projects and roadmaps can easily be shared with Office 365 groups or individuals

#12. As mentioned in #1, Projects from Azure Boards can be brought into the roadmaps.

As you can see, both Project For Web and Roadmap are very user friendly, easy to use products.

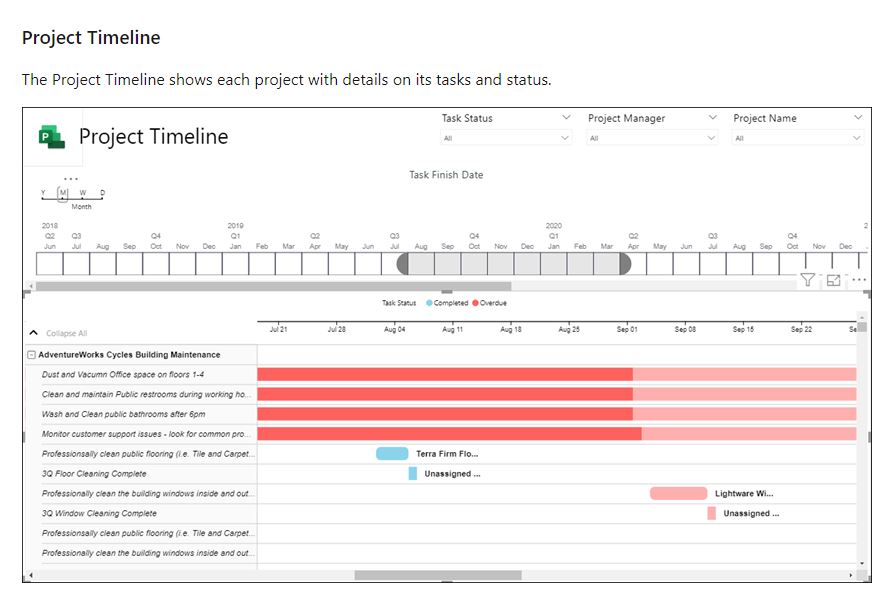
One important item to add is the new Power BI template that can be used out of the box to give great information and insights to the leadership team or executives.

Below you will see a few images of the reports available. To learn more about this PowerBI template, please click here.

Considerations for building better APIs

What is an API?

In the simplest of terms, API is the acronym for Application Programming Interface, which is a software intermediary that allows two applications to talk to each other. In fact, each time you check the weather on your phone, use the Facebook app or send an instant message, you are using an API.

Every time you use one of these applications, the application on your phone is connecting to the Internet and sending data to a server. The server then retrieves that data, interprets it, performs the necessary actions and sends it back to your phone. The application then interprets that data and presents you with the information you wanted in a human, readable format.

What an API really does, however, is provide a layer of security. Because you are making succinct and explicit calls, your phone’s data is never fully exposed to the server, and likewise the server is never fully exposed to your phone. Instead, each communicates with small packets of data, sharing only that which is necessary—kind of like you ordering food from a drive-through window. You tell the server what you would like to eat, they tell you what they need in return and then, in the end, you get your meal.

Excerpt from “Undisturbed REST”

Type of APIs

Six Key Constraints to REST

  • True Client-Server Inter-dependencies
  • Stateless: States should be stored on the Client, not Server
  • Proper Management of Cache on the Client
  • Uniform Interface; in a single language, independent of the architectural back-end of either
  • Layered System with loosely coupled modules
  • Code on Demand / Smart Applications

For more information on the different constraints, you can read Dr. Fielding’s full dissertation online at:
http://www.ics.uci.edu/~fielding/pubs/dissertation/top.htm
.

Consider these while planning your API:

  • Design for great user experience
  • Clear Understanding and Definition of the Audience/Users of your API
  • Clear Understanding and Definition of the Actions of your API
  • Review of how your API and application will interact with Existing Services
  • Security of your API
  • Avoid hard coded resources or actions
  • Maintenance and Versioning of your API
  • Documentation & Support of your API
  • Monitor the usage and performance of your API
  • Promotion and Socialize of your API
  • Build a community
  • Continue to improve
Understanding the Audience/Users and Actions
Spec Comparison

For more information about APIs, also check out ProgrammableWeb.com

To be continued…

Streamlined Project/Team Management via A-ha

I came across this tool, A-ha, recently and after looking into it a bit more deeply, I think it could be really useful for some organizations/teams.

A-ha can be used at the high level for Strategic Planning and Roadmap or can be implemented for more detail level processes; such as Requirements Gathering, Scoring & Prioritization and Capacity Management.

I captured some of the high level functionalities; along with a few sample screenshots and links to those specific functionalities, so you can see more information on their website.

A few points to highlight:

  • Each team can have their own Workspace and have their own appropriate template, unique configuration, customization, setup and integration
  • This is a highly customizable tool. It’s very easy to add custom fields, change the scoring mechanism, integrations etc. either at the company level or workspace level
  • Integration with DevOps (VSTS) works really well. I tested it myself and it could be customized at the Workspace/Team level. Each integration can have its own field mapping, each individual fields can be set up to indicate whether this particular field is flowing from A-ha to DevOps, from DevOps to A-ha or both ways, whether that’s 1 time flow or continuous update
  • The presentations and reports can be published publicly or a certain group of people. Because it’s integrated with VSTS/DevOps, the data in the presentations/reports are live and always accurate (well, as accurate as the data in VSTS). No more manual updates for decks. Executives, Stakeholders, Internal and External customers can be given access to the Roadmaps, Presentations or Reports and can easily follow the status of their projects, requirements or requests, live! 
  • Very detailed Capacity Planning. Management can easily see who is working on what, what bandwidth everyone has and manage the teams much more effectively
  • It can be a great, centralized and consistent tool to receive requests, requirements, feedback and ideas from our internal teams/users, from our clients and suppliers via customizable Ideas boards
  • It can work with minimal or no distraction to existing processes.  PMs, Tech Leads, Development, QA, BA can still do what they are doing today and manage their projects and work via the tools that they currently use (as they do today). Via the powerful integration capabilities, the data can flow from current development tools, such as VSTS into A-ha or vice versa, from A-ha to VSTS. New backlog items can be entered into A-ha (via Ideas Boards, manually or maybe even from other third party tools, such as Salesforce), they can be managed/prioritized (via scoring) in A-ha and pushed to VSTS for the teams to work on. Updates on Effort, Remaining Hours, Statuses etc. can be sent from VSTS back to A-ha.

Streamlined Presentation / Generating Documents, PPTs Automatically with Dox42

I recently came across this tool, dox42, that I think is pretty cool and can help teams and organizations reduce/eliminate some of the administrative tasks and produce information from the source systems not only correctly, efficiently and in a consistent way but also automatically.

Some of the benefits for using this (or similar tools) can be:

  • Dox42 allows business users to create complex, detailed document templates via the tools that they already use such as MS Word, Excel and PowerPoint
  • The tools allows integration from different source systems; such as MS Teams, SharePoint, CRM systems, MS Excel, Access or SQL databases
  • The tool allows the templates to be centralized. They can be updated (adding/removing fields, changing company logo etc) very quickly and easily (versus telling everyone to update their templates individually)
  • The templates allow users to generate documents (Word, Excel or PowerPoint) with a click (regardless of how many slides or pages)
  • It prevents incorrect data to be shared. Since the data would be coming directly from the source systems, no manual updates to the documents needed
  • It eliminates copy & paste errors, misalignment or inconsistent formatting throughout the documents
  • It can include complex calculations or graphs that could be automatically updated, thus, eliminates incorrect data

Dox42 can integrate with a lot of technologies, not just MS products (as shown below).

I explored and tried generating PowerPoint slides for my projects. You can see the dox42 template I created below. This template brings data from an existing project management SharePoint site and a SQL database. The PowerPoint slides are generated automatically per project, so it doesn’t matter if it’s 1 project or 100. Since this is a template, once the data points or labels or format is changed in the template, it would be automatically changed in all slides generated. Once the slides were generated, they can still be updated manually with further data/comments too, if needed.

Here is the screenshot of one of the PowerPoint slides that was generated automatically for a sample project. As we discussed above, all fields are coming directly from SharePoint Project Tracking or SQL database. Budget Chart calculations are done in a temp Excel and then brought into the PowerPoint. The data/images are displayed dynamically (i.e. indicator colors, project manager’s picture, etc).

Below short video shows how easy and quick to create documents directly in SharePoint, from an end user point of view.

Useful Tools, Resources & Links

Training / Resources

Project Management / PMO

Architecture & Security

AWS

GCP

AI/ML

Autonomous Vehicles

News

Misc Tools

UI / UX

FRONT-END

BACK-END

[cryptothanks]